The Environmental Sensitivity Index (ESI) map concept and procedures were developed in the mid-1970's in response to the need to rapidly and comprehensively indicate shorelines and ecological and socio-economic resources that are sensitive to oil spills. Both industry and governments utilize these maps to identify and protect most-sensitive habitats and localities. Gundlach and Hayes (1978) first described the ESI (then called the Vulnerability Index) concept of using a scale of 1 to 10 (10 is most sensitive) to indicate shoreline sensitivity. Around the same time, the index was expanded to indicate sensitive ecological and socio-economic area by using symbols and patterns to indicate point or polygon locations. Michel et al. (1978) described application of the shoreline ranking to Lower Cook Inlet, Alaska.
Ecological and socio-economic resources are not ranked in terms of sensitivity. During practice spill exercises and real events, all information provided on the ESI maps is considered by the responder to determine the most appropriate actions based on the immediate conditions of the event (e.g. spill source and movement, weather, available equipment and manpower).
Environmental sensitivity mapping has been widely accepted internationally for many years; for example, mapping in Nigeria began in the early 1980's. Gundlach et al. (1981) present the concept and suggest the shoreline categories that would be used for Nigerian shorelines. Over the years it has been accepted on a fairly universal level (e.g. International Maritime Organization and UNEP (see Gundlach and Murday, 1987) and IPIECA (1996).
Although nuances exist between the versions of sensitivity maps dependent on the area of study and project objectives, basics of the mapping have remained constant throughout almost all ESI projects, which serves to support the validity of its original conceptual design and format. These basic concepts include the following:
1. Sensitivity maps are designed to provide the necessary environmental information to the user from which a decision can be made regarding spill response priorities and appropriate cleanup methods.
2. Sensitivity encompasses three primary components: physical/geomorphic, biological and human use (socio-economic). A forth category, "spill-response" is also seen on approximately half the mapping projects.
3. The sensitivity of the human-use and biological components may vary widely depending on season or other factors.
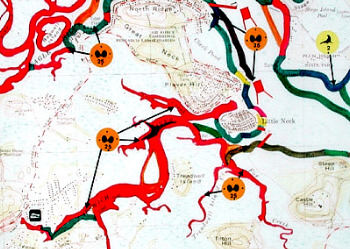
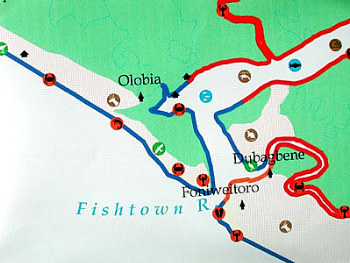
4. The physical/geomorphic attribute (of the shoreline type or interior habitat) is ranked in order of increasing sensitivity, most commonly but not exclusively on a scale of 1 to 10.
5. The biological attributes associated with the geomorphic component are included in the sensitivity evaluation of that component (e.g. mangrove shorelines are a coastal geomorphic type and show high biological diversity)
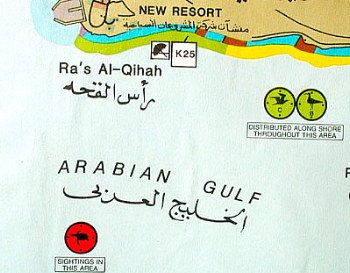
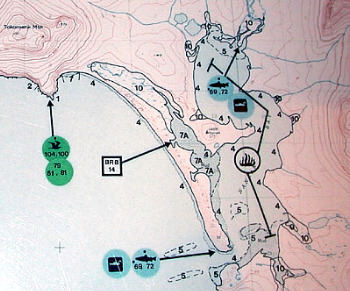
6. Other biological attributes (e.g. bird colonies, fishing grounds, etc.) are mapped as point localities or polygons, but are not given a sensitivity value.
7. Socio-economic attributes (e.g. villages, shrines, boating areas, etc.) are similarly mapped as a point locality or polygon but not given a sensitivity value.
Following these very basic principals, it is important to state that sensitivity maps do not:
1. Indicate compiled sensitivities (e.g. physical + biological + socio-economic = final sensitivity). It is up to the user to evaluate the relative sensitivities of each component during a spill to define the most appropriate response measures for the specific time and place of the incident.
2. Show varying sensitivities for the same habitat. The defined shoretype or interior habitat has the same sensitivity value, although when combined with other attributes, primarily biological and socio-economic features, the priority for response and/or protection of a particular area within the habitat may be increased.
It should be noted that several attempts have been made to define a total sensitivity. Some methods have developed a range of sensitivities based on multiplying values; so that instead of 10 categories, there may be 70 to 100 categories of sensitivity. Under these conditions, the maps become overly complex and difficult to use during a spill response. Additionally, these cases have essentially indicated that groupings (e.g. from 70-80) are treated like a single category, so the end result is roughly a 1-10 categorization again.
Map Scale: The scale at which the maps are to be produced influences the information needed. For instance, producing at a scale of 1:100,000 does not require the detailed characterization of a tidal flat 100 m by 100 m (which would be 0.1 x 0.1 cm on a 1 m map). Whereas production at a scale of 1:1,000, where it is now represented as 10 x 10 cm on a 1 m map, may find such a characterization very useful to determine areas of higher sensitivity (more biomass) if it is located in front of a facility.
Commonly a scale of 1:24,000 in the United States is used, conforming to 7.5 minute quad sheets. Recently in Nigeria, we have used a scale of 1:50,000 using LandSat satellite images as a basis.
Terminology: The use of the terms Vulnerability and Sensitivity are frequently confused, particularly in the context of oil spill sensitivity mapping and prioritization of resources. The following definitions are relevant to this report:
Vulnerability to oil spills: A resource is defined as vulnerable if it is likely that it would be exposed to either physical oil or high concentrations of oil for long enough periods for the oil to affect it. Most intertidal resources are vulnerable to oil spills because surface oil could become stranded upon them. However, wave exposed shores are less vulnerable than sheltered shores because wave action removes the oil quickly on exposed shores. Subtidal resources are less vulnerable to oil spills because most of the oil normally remains on the surface and it is unusual for high concentrations of oil to persist in the water for long periods. However, shallow subtidal resources (less than 5 m) are more vulnerable than deeper resources because concentrations of oil become increasingly diluted with increasing depth. Vulnerability of a resource can also include consideration of the resource's location in relation to shipping traffic and industrial areas - i.e. resources close to shipping lanes, refineries and ports will be more vulnerable to oil spills than resources further away.
Sensitivity to oil spills: In its strict sense, a resource is defined as sensitive to oil if it would be acutely affected by contact with either physical oil or concentrations of oil in water. However, this definition could include resources that have a very low vulnerability to oil spills, e.g. coral reefs in deep water, or fish farm ponds where water is recycled rather than pumped in daily from the sea. These resources may be very sensitive to oil, but for the purposes of this report, they are not considered to be sensitive to oil spills. Thus, the way that Sensitivity is used in this report includes consideration of a resource's Vulnerability.
References:
Gundlach, E.R. and M. Hayes, 1978. Classification of coastal environments in terms of potential vulnerability to oil spill damage. Marine Technology Society Journal, vol. 12(4), p. 18-27. (download: 1.7 mbytes)
La Vunerabilidad de los Ambientes Costeros a Los Impactos de Derrames de Petroleo (en español). (download: 2.7 mbytes)
Gundlach, E.R. and M. Murday, 1987. Oil Spill Sensitivity Atlas for Mauritius. Prepared for United Nations, International Maritime Organization, U.N. Development Program, and Mauritius Ministry of Housing, Lands and the Environment, 146 pp.
Gundlach, E.R, M.O. Hayes and C.D. Getter, 1981. Sensitivity of coastal environments to oil spills. Proc. Seminar, Petroleum Industry and the Nigerian Environment, Warri, Nigeria. p. 82-88. (download: 13 mbytes)
IPIECA, 1996. Sensitivity Mapping for Oil Spill Response. International Maritime Organization and IPIECA, 24pp. (IPIECA Link)
Michel, J., M.O. Hayes and P.J. Brown, 1978. Application of the oil spill vulnerability index to the shorelines of Lower Cook Inlet, AK. Environmental Geology, 1(2), p. 107-117.
NOAA, 1996. ESI Guidelines, Technical Memorandum NOS ORCA 115, 175 pp. (NOAA Link) |