For a variety of governmental agencies and private corporations, we prepared environmental sensitivity atlases which delineate shoreline types, wildlife resources (species and seasonality), socioeconomic features, and spill-response strategies. These maps have been used extensively in coastal planning and emergency response efforts. The International Maritime Organization and United Nations Environment Program have also been very supportive in using this map format to assist other countries in delineating critical coastal habitats. Using a Geographic Information System (GIS), we have developed computerized mapping and data-tracking program that is able to produce maps of any size and scale and that can be linked to various databases. Digital photography taken from aircraft or during ground surveys is linked to locations on the sensitivity maps.
Maps have been prepared in English, as well as bilingual with Japanese, Russian, French, Spanish and Turkish.
Project Summaries are below. For additional technical details - CLICK HERE! .
ESI Project Areas
Alaska
Cape Suckling, SE to Canadian border in Beaufort Sea, GIS, shoreline only.
Norton Sound, Alaska, 65 maps
Pribilof Islands, 1 poster map
Shelikof Strait / Kodiak Island, Alaska, 47 maps
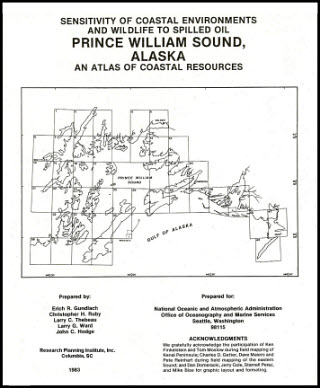
Prince William Sound/Copper River, Alaska, 46 maps
Elsewhere in U.S. and Canada
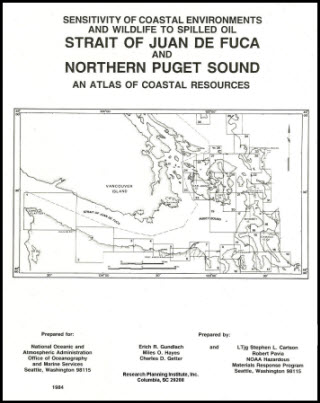
Strait of Juan de Fuca/N. Puget Sound, Washington, 42 maps
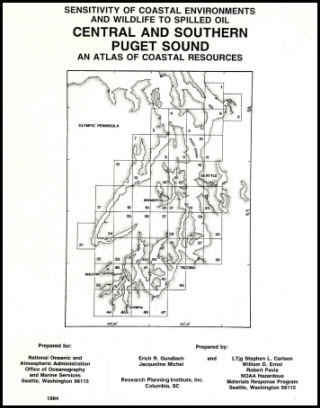
Central and Southern Puget Sound, Washington, 47 maps
Southern California, 56 maps
Orange County, California (GIS map)
Galveston Bay, Texas, 19 maps
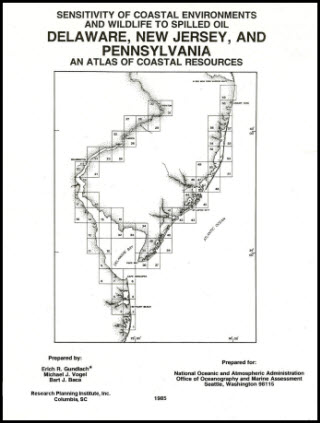
Delaware/New Jersey, 59 maps
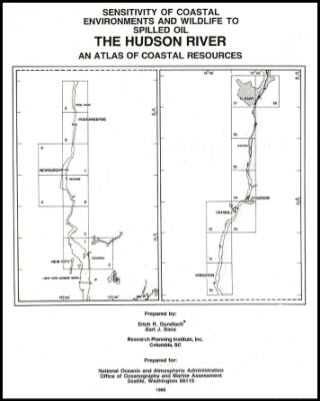
New York, 69 maps
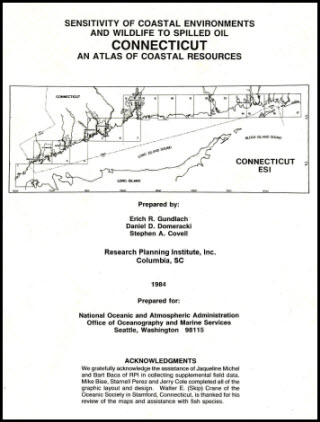
Connecticut, 17 maps
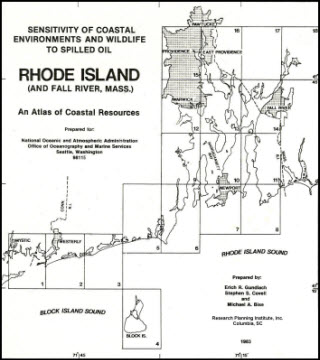
Rhode Island, 17 maps
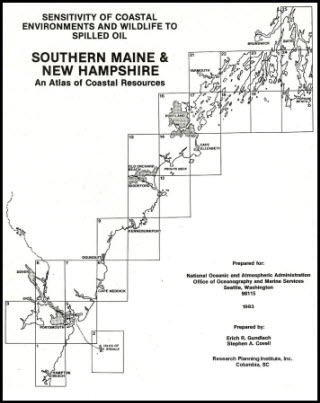
Southern Maine/New Hampshire, 25 maps
Mid-Coast and DownEast Maine, 90 maps
St. Lawrence River, New York, and Ontario Canada, 30 maps
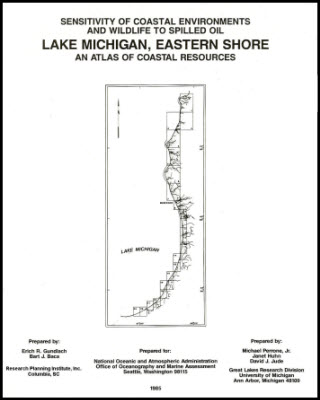
Eastern Shore of Lake Michigan, Michigan, 12 maps
St. Mary's River, Ontario and Michigan, 22 maps
St. Clair River and Lake Ontario, 17 maps
INTERNATIONAL
Turkey: Pipeline and Marine areas, 100 maps.
Panama, Western: Atlantic and Pacific sides
Panama Canal, digital map, sensitive sites only.
Dominican Republic, resources only.
Nigeria - entire coast, 7 maps; 1:50,000 scale
Nigeria - Ogoni Land, GiS, 1:25,000 scale.
Kuwait - entire coast; 13 maps
Saudi Arabia (GIS map, Gulf War impact area)
Mauritius, 19 maps
Kazakhstan (Caspian Sea), 5 maps
Indonesia (offshore Djakarta), 5 maps
ESI Publications
Classification of coastal environments in terms of potential vulnerability to oil spill damage. Marine Technology Society Journal, vol. 12(4), p. 18-27.Sensitivity ranking of energy port shorelines. Proc. Ports ’80, Amer. Soc. Civil Engineers, Norfolk, VA, p. 697-708.
Sensitivity of coastal environments to oil spills. Proc. Seminar, Petroleum Industry and the Nigerian Environment, Warri, Nigeria. p. 82-88.
Umvelt-Sensitivitäts-Kartierung, eine kostengustige strategie zur minimierung von schäden durch olunfalle (Minimization of impacts resulting from oil spills by environmental sensitivity mapping). Proc. Intermaritec. Hamburg, pp. 302-310. Germany.
The oil spill environmental sensitivity index applied to the Alaskan Coast. Proc. Arctic Marine Oilspill Program, Environment Canada, Ottawa. p. 311-323.
Resource mapping and contingency planning, PTP pipeline facilities, Panama. International Oil Spill Conference, American Petroleum Institute, Wash. DC.
Pribilof Islands, Alaska – an area of extreme environmental sensitivity. International Oil Spill Conference, American Petroleum Institute, Wash. DC, 10 pp.
Incorporating biodiversity into sensitivity maps of the Niger River delta. International Oil Spill Conference, American Petroleum Institute, Wash. DC.
Oil spills, impact, recovery and remediation. Invited speaker, International Coastal Symposium, Santa Catarina, Brasil, J. Coastal Research, 4 p.
Pipeline and Coastal Environmental Sensitivity Mapping for the BTC Pipeline System in Turkey. International Oil Spill Conference, American Petroleum Institute, Wash., DC.
Using ShoreZone Imagery to Improve Environmental Sensitivity Maps, Examples from Prince William Sound. International Oil Spill Conference.
Improving ESI Maps with Low-Level Imagery (ShoreZone), Alaska
2011, ExxonMobil
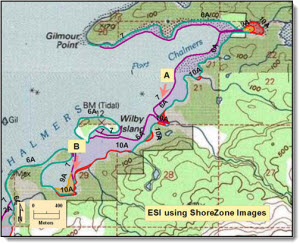
Environmental Sensitivity Index (ESI) mapping proposes to provide accurate representation of an area’s shoreline categorized as to shoreline type on a scale of 1 to 10 determined by sensitivity to spilled oil. Originally, field work utilized the hand-drawing of categories onto USGS topographic maps while seated in an aircraft flying the coastline. ESI categorization could only be verified by photographs taken at the time and by intermittent ground truthing. ESI maps could not be verified by others, especially if remote coastline was involved.
Today large sections of the Alaskan coastline have been flown by the ShoreZone program which has captured high-resolution still photographs (able to resolve shoreline features of ~0.3 m and less) and lower resolution continuous video imaging taken from a low- and slow-flying helicopter. Both video and still photographs are readily available at (http://alaskafisheries.noaa.gov/) enabling a desk-side review of any specific location at any time. A voice-over recorded during the survey is also available, but not online.
Prince William Sound (PWS) has been ESI-categorized several times, most recently in 1999 (2007 digital re-release). I compared several parts of the current PWS ESI shoreline with ShoreZone imagery using the ESI maps in ESRI ArcMap and supported by GoogleEarth. Multiple examples find that the current ESI maps commonly do not take into account features less than ~100 m in length (thereby omitting many pocket gravel beaches and rock platforms), may overlook features (e.g. large tidal flats as in the Port Chalmers and Lower Passage areas), have the wrong location for divisional boundaries between shoreline types, are inconsistent within a shoreline type category (particularly sheltered rubble slopes (8D)) and, while getting the overall features generally correct, are commonly in error at many specific locations.
A thorough review of current ESI shoreline maps using the readily available ShoreZone images will improve both the accuracy and resolution of these maps, not only in Prince William Sound but in other areas where ShoreZone images are available.
Gundlach, E.R., 2011. Using ShoreZone Imagery to Improve Environmental Sensitivity Maps, Examples from Prince William Sound. International Oil Spill Conference. download
Sensitivity of Inland Environments along the 1076 km BTC Pipeline in Turkey
Botas BTC Project
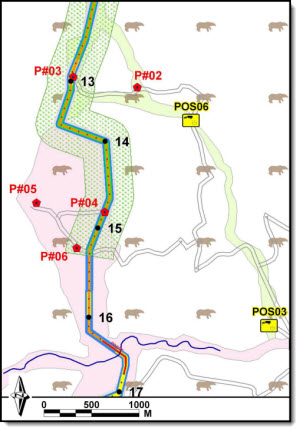
Sensitivity mapping was completed for the entire 1076 km (645 mi) of the Baku-Tbilisi-Ceyhan (BTC) Pipeline Project in Turkey. Pipeline sensitivity maps include environmental, human-use and
archaeological features as well as drainage patterns indicating potential oil flow and
downstream sites for spilled oil containment.
All information is compiled
and stored using a Geographic Information System (GIS) from which hardcopy maps are
created at various scales, depending on purpose. Both integrated and stand alone databases
are used to quickly access needed environmental and response information. Map and text based
data are stored on a central server to provide internal accessibility and via a web-based,
interactive internet mapping system. This is the first time that formalized sensitivity mapping has been completed in Turkey. Maps were prepared in English and Turkish.
Gundlach, E.R., H.M. Cekirge, R. Castle, and P. Sutherland, 2005. Oil Spill Response and Equipment for the BTC Pipeline System in Turkey. 2005 International Oil Spill Conference. download
Gundlach, E.R., H.M. Cekirge and C. Anul, 2005. Pipeline and Coastal Environmental Sensitivity Mapping for the BTC Pipeline System in Turkey. 2005 International Oil Spill Conference. download
Sensitivity Mapping and Spill Containment Sites, Iskenderun Gulf, Turkey
Botas BTC Project t
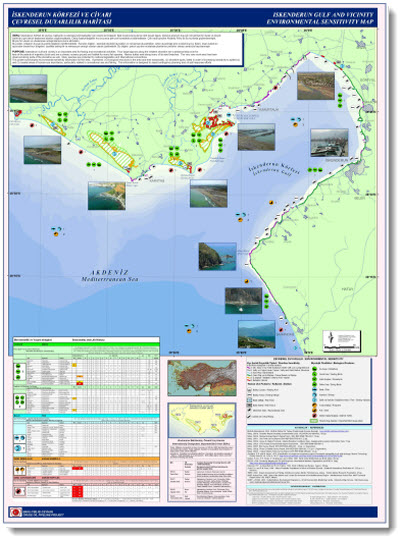
ESI mapping was carried out for the eastern Mediterranean in response to the development of a new oil terminal at Ceyhan (Iskenderun Gulf) by the Baku-Tbilisi-Ceyhan (BTC) Pipeline Project. The zone of mapping was determined by risk analyses and oil spill modeling prepared for the terminal and marine traffic route. In addition to the risk analyses, background data included the project EIA and related surveys. Shoreline types and important human use areas were mapped using video overflight data (with internal latitude / longitude overlay) verified by ground truthing.
The highest ecological sensitivity is found in the marshes, tidal flats, and shallow waters of Iskenderun Lagoon (ESI 9 and 10) and other lagoons south of the Terminal. These areas are also internationally designated Important Bird Areas (IBAs). Nesting sites of marine turtles (critically endangered green (Chelonia mydas) and loggerhead (Caretta caretta)) are found on the pocket sand beaches south of the Terminal and along the sand beaches south and west of Iskenderun Gulf. The region supports a commercial fishery, although it is in a noted state of decline. Rare occurrences of the critically endangered monk seal (Monachus monachus) are also noted in the area.
From the sensitivity and risk analyses, 14 oil spill containment sites were located to protect the most sensitivity environments. This information, compiled using a GIS, was utilized to create 1:30,000-scale hardcopy and on-the-web map formats. The containment site description includes geographic location, driving instructions, rationale and criteria (spill size / location) for implementing protection, type of equipment needed, and aerial and ground photographs of the site.
Sensitivity Mapping, Pribilof Islands, Alaska
NOAA and U.S. Coast Guard)
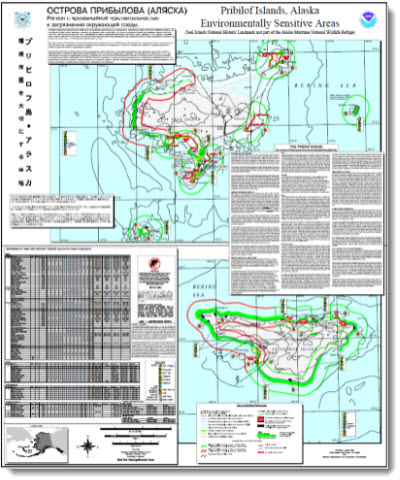
The Pribilof Islands, five small islands in the middle of the Bering Sea, are among the most environmentally rich areas of the world. During the warmer months, they are home to approximately 1 million fur seals and over 3 million seabirds. Greatest populations occur from mid-May to September, but some fur seals remain into December. An oil spill during this time would be devastating. At other times of the year, it has the potential to affect over-wintering species and may interfere with fur seals returning the next season. Several ship wrecks and oil spills have already occurred, the most recent being a spill of unknown origin during the winter of 1996, when hundreds of birds were affected. Working together, state and federal agencies have undertaken specific measures to reduce the risk of spills in this area, and to better plan if one should occur. The poster-sized map was prepared in English, Russian and Japanese, with the intent to be given to fishing vessels working in the area.
Gundlach, E.R., Kendziorek, M. and others, 1999. The Pribilof Islands, Alaska – an area of extreme environmental sensitivity. 1999 International Oil Spill Conference, American Petroleum Inst. Wash. DC, 10 pp. download: article, poster
U.S. Pipelines - Mapping Inland Unusually Sensitive Areas
American Petroleum Institute
This stage of the project was to select and compile of all sensitive environmental habitats along six pipeline segments (>600 miles long) located in the northeast, north-central, south, southeast, and western parts of the U.S. Pipeline diameters varied from 8" to 40". The analysis of sensitive resources included information on threatened, endangered, and protected species, sole source aquifers, community drinking water supplies, wetlands, protected state and federal lands. Cost estimates were made for each segment for positioning remotely controlled block valves, hydrostatic testing, and smart pigging, in response to the collected environmental data. Costs were then extrapolated to the pipeline industry as a whole to provide estimates of total industry costs of each method.
Sensitive habitats along U.S. pipelines, data were mapped using ArcCAD and Spatial Analyst to generate various analyses of sensitivity elements. ArcView was used for viewing the different environmental data elements involved in the study, which included the following for six major pipelines in New York, North Carolina, Illinois, California, Louisiana, and Alabama: all wetlands (classified by the National Wetland Inventory), public lands (parks, refuges, etc.), public drinking water intakes and sole source aquifers, habitats of threatened and endangered species, state and federally designated critical habitats, primary and secondary road networks, and streams and rivers.
Coastal and Inland Sensitivity Mapping, OML11, Niger Delta, Nigeria
Shell Nigeria, ERML, Lagos
In Nigeria, t he Federal Ministry of Environment (FMEnv) and the Department of Petroleum Resources (DPR) recognize ESI maps as useful tools for improved oil spill response. Their regulatory requirements stipulate a need for improved oil spill contingency planning. Towards this end, ESI mapping was carried out for both coastal and land-based environments in Oil Mining Lease area 11 in the Niger River delta. This project was the first application of the ESI protocols developed under sponsorship of the oil industry in Nigeria.
Oil Mining Lease (OML) 11 is located in the southern part of Nigeria. It extends from Latitude 40 28’N to 50 2’ and Longitude 70 2’E to 70 39’E. Most of the OML lies within the Niger Delta. It straddles a number of habitat types from its northern predominantly terrestrial environment through coastal swamps in the southern portions and extending to sections of the Nigerian outer coastline. OML 11 is one of the largest OML concessions in the Niger Delta. Three of the 21 Rivers that punctuate the Niger Delta as distributaries run through OML 11. These are from east to west of the OML: Bonny River, Andoni River and Imo River. The OML also cuts across three states; Rivers, Abia and Akwa Ibom states. OML 11 has an estimated area of about 3,096 square km.
The project was carried out using satellite imagery, overflights, and low-altitude videography. The ESI includes shoreline types and socio-economic information for the area, as well as oil facility data and village locations. ERML of Nigeria was the lead contractor for the Project.
Mapping Protocols for Sensitivity and Biodiversity, Coastal and Inland Habitats, Nigeria
OPTS, ERML, Lagos
Shoreline sensitivity maps are based primarily on geomorphology and the likelihood of spill persistence. Some of the most diverse communities (exposed rocky shores) may be ranked low because wave action negates many affects of the oil. Land-based habitats do not have this capability and therefore needs another mechanism to determine “sensitivity” to oil.
With the basis that more bio-diverse communities are more inherently valuable as an ecological resource, we have derived a system of classifying the tropical environments of the oil-producing delta regions of Nigeria based on a number of field-collected parameters that attempt to measure the degree of biodiversity as well as potential spill persistence and difficulty of cleanup.
Physical parameters include type of substrate, presence of near-surface groundwater and inhibiting layer, and extent of surface debris. Biological parameters include tree density (stocking), coverage by grasses and shrubs in the understory; plant condition, species richness and diversity (mammals, reptiles, amphibians, birds), important medicinal or endangered species, and special or unique biological features.
The project was sponsored by the Oil Producers Trade Section (OPTS) of the Lagos State Chamber of Commerce; the umbrella organization of oil producing companies in Nigeria together with the Nigerian National Petroleum Corporation (NNPC) acting through Chevron Nigeria Limited (CNL).
Gundlach, E., V.O. Imevbore, B. Witherspoon and J. Ainodion. 2001. Incorporating biodiversity into sensitivity maps of the Niger River delta. 2001 International Oil Spill Conference. download
Sensitivity Mapping of Caspian Sea, Entire Coast of Kazakhstan
KazakhCaspiShelf (AGIP)
As part of a multinational, and multidisciplinary environmental impact analysis related to the impact from future seismic operations, a broad range of environmental and technical data from the region was collected and evaluated. Information was then used to develop a series of sensitivity maps indicating (1) biologically important areas, (2) biotopes (both terrestrial and aquatic habitats), (3) major infrastructure and existing sources of pollution and environmental impact, and (4) geologic and geomorphic subdivisions. Both fieldwork and LANDSAT image analysis (1:200,000 scale) were used to delineate land and coastal habitats. Map text was provided in both English and Russian. The sensitivity of habitats and species was categorized in terms of location and life stage.
Metzger, B.H., E. Zholdasov, P. Manella, G. Khobdabergenova, D.I. Little and E.R. Gundlach, 1995. Environmental Sensitivity and Protection for the Northeast Caspian Sea. International Oil Spill Conference, 3 pp.
download
Shoreline Sensitivity and Physical Characteristics Database, Most of Coastal Alaska
Minerals Management Service
This Project developed a Geographic Information System (GIS) to classify, edit, and retrieve shoreline characteristics data for the Arctic, Bering Sea, and Gulf of Alaska regions. The data were provided in hard copy and digital format for use in a standard database to input data to the Coastal Zone Oil Spill model (COZOIL). Altogether, 33,360 subsegments representing 23,582 km of shoreline were defined and characterized, as follows:
Shoreline characteristics: shoreline type, length, azimuth or angle of the shoreline. Data were obtained by digitizing best available topographic maps (usually 1:63:360 scale) with shoreline types primarily derived from previous sensitivity surveys.
Shoreline type: coded numerically where 1 = rocky shores and riprap, 2 = cobble/boulder beaches, 3 = eroding peat or tundra scarps, 4 = sand beaches, 5 = mixed sand and gravel beaches, 6 = tidal flats, 7 = marshes, 8 = lagoon or pond inlets, 9 = rivers, and 10 = major open boundaries (e.g., across Cook Inlet). For shore types 1 to 7, the width and slope of the backshore and foreshore were characterized based on three previous field studies.
Tidal range and currents: based on NOAA/NOS Tide and Current Tables and numerical modeling results for each segment
Air and water surface mean temperatures and ranges: for each segment based on the Alaska OCS Climatic Atlas
Wind speed and directional standard deviation for each segment based primarily on the Alaska OCS Climatic Atlas
The presence/absence of ice in each segment based on the Alaska Marine Ice Atlas
Wind fetch: computed for each subsegment for eight compass directions for 12 months a year and taking the presence of ice into account
Gundlach, E.R. and R. McMahon. Computerized (GIS) sensitivity mapping in Alaska. International Oil Spill Conference.
Gundlach, E.R. and M. Reed. Shoreline segment characteristics handbook for SMEAR model application, Arctic, Bering Sea, and Gulf of Alaska regions. Prepared for Minerals Management Service, approx. 4000 pp.
Reed, M. and E.R. Gundlach, 1989. Hindcast of the Amoco Cadiz event with a Coastal Zone oil spill model. Oil and Chemical Pollution, vol. 5, p. 451-476. download
Environmental Sensitivity Mapping, Kuwait
Kuwait Foundation for Adv. of Science, Kuwait University
To assist the Kuwait government and associated agencies in planning against oil spills, a detailed shoreline characterization study was carried out by a joint Kuwaiti-U.S. study team including Dr. Mohammed Al Sarawi of Kuwait University. The study characterized the shoreline and its habitats in terms of shoreline type, ecological components, sediment type, beach slope, and grain size. The shoreline types of Kuwait were ranked as follows in terms of increasing sensitivity to oil spills:
1. Concrete seawalls and harbor structures (18.2 km)
2. Beachrock outcrops (15.6 km)
3. Fine-sand beaches (46.8 km)
4. Medium- to coarse-sand beaches (346.0 km)
5. Hard-sand or mud tidal flats with low productivity (260.6 km)
6. Riprap (boulder) structures (72.6 km)
7. Cobble/boulder beaches (3.1 km)
8. Exposed bedrock platforms (52.1 km)
9. Hard-sand or mud tidal flats with high productivity (72.6 km)
10. Soft-mud tidal flats with high productivity (338.7 km)
Al Sarawi, M., E.R. Gundlach and B.J. Baca, 1988. Analysis of Kuwait’s coastal resources in terms of sensitivity to oil spills. Kuwait Foundation for Advancement of Science, 29 pp. + map atlas.
Al Sarawi, M., E.R. Gundlach and B.J. Baca, 1988. Coastal geomorphology and resources in terms of sensitivity to oil spills in Kuwait. Kuwait Journal of Science, Vol. 15, p. 141-184. download
Sensitivity Mapping, Java/Sumatra, Indonesia
Maxus, Jakarta
The project was to develop a computer-based sensitivity map of the shorelines and waters of the junction of Java and Sumatra. It included scientists and resource managers from Indonesian, Australian, and the United States. Satellite imagery (SPOT) was used for the initial broad-scale interpretation of the shoreline habitats, then verified by ground surveys and low-altitude overflights. The satellite imagery was particularly useful in delineating fish-ponds, mangroves, tidal flats, and parts of the coral reef habitats in the Thousand Island area. Australian scientists completed a series of transects going from +2 m to –5 m, utilizing on-site notations and video photography. The video photography was analyzed using a video-computer interlink which enabled classification of primary coral reef and plant species along the transect. Using the same system, information is directly input into a database for statistical analyses. The low-altitude overflights and ground surveys were further able to classify the following habitats: rocky shores, vertical headlands, sand beaches, mixed sand and gravel beaches (primarily coral rubble), as well as specifically locate coral-dominated habitats. Utilizing information collected in Indonesian by various agencies, information was obtained concerning the size and importance of fishing villages, locations of primary fishing grounds, recreational areas, park and wildlife refuges, and sites of international concern. The developed computer-based GIS enables information to be updated, as well as selection of specific information wishing to be displayed.
Environmental Sensitivity Maps, Mauritius
IMO (London) and UNEP (Nairobi)
The Government of Mauritius, the International Maritime Organization (London) and the United Nations Environment Program sponsored this project to develop a Coastal Sensitivity Atlas detailing the sensitive resources of Mauritius and the methods for their protection. The project was developed in support of the Convention for the Protection, Management and Development of the Marine and Coastal Environment of the Eastern African Region and its protocol on emergency cooperation. The project included extensive participation of Mauritian scientists and resource managers and close ties with the Ministry of Housing, Lands and the Environment to ensure the incorporation of all relevant environmental and socio-economic resource data. Detailed response procedures were worked out between agencies by our personnel serving as a catalyst. All documents were produced in French and English.
Murday, M. and E.R. Gundlach. Oil spill contingency planning in Mauritius. Oil Spill Conf., American Petroleum Institute, p. 539-545. download
Murday, M. and E.R. Gundlach. A National Oil Spill Contingency plan for Mauritius. Prepared for United Nations, International Maritime Organization, U.N. Development Program, and Mauritius Ministry of Housing, Lands and the Environment, 146 pp.
Environmental Sensitivity Maps, Western Panama and Panama Canal
IMO (London) and UNEP (Nairobi)
This project involved the development of an effective oil-spill response plan for PTP Terminal facilities in western Panama (Atlantic and Pacific Coasts) and for the Panama Canal. In both cases, sensitivity maps included shoreline and wildlife information to enable spill response planning
Gundlach, E.R., I.F. de Vincenti, G. Moss, and J. Janssen. 1985. Resource mapping and contingency planning, PTP pipeline facilities, Panama. international Oil Spill Conf., , Wash. DC. download
Sensitivity Mapping / Response Modeling, Niger River Delta
Chevron Nigeria, Lagos
As part of the first large scale environmental study of the Niger River Delta, the first Environmental Sensitivity Map was made of the entire coast of Nigeria. The shoreline was characterized at scales ranging from 1:25,000 to150,000, depending on available maps. The second part was to develop a preliminary oil spill trajectory model which provided the general areas of impact from a potential offshore oil spill.
Gundlach, E.R., M. Spaulding, and M. Reed. 1987. A coastline oil spill model with reference to Nigeria. Seminar on the Petroleum Industry and the Nigerian Environment, Owerri, Nigeria, 6 pp.
 as to shoreline type on a scale of 1 to 10 determined by sensitivity to spilled oil. Originally, field work utilized the hand-drawing of categories onto USGS topographic maps while seated in an aircraft flying the coastline. ESI categorization could only be verified by photographs taken at the time and by intermittent ground truthing. ESI maps could not be verified by others, especially if remote coastline was involved.
 maps include environmental, human-use and
archaeological features as well as drainage patterns indicating potential oil flow and
downstream sites for spilled oil containment.
maps include environmental, human-use and
archaeological features as well as drainage patterns indicating potential oil flow and
downstream sites for spilled oil containment. 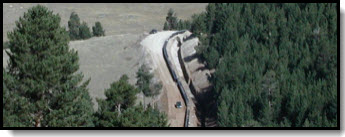
 Ceyhan (Iskenderun Gulf) by the Baku-Tbilisi-Ceyhan (BTC) Pipeline Project. The zone of mapping was determined by risk analyses and oil spill modeling prepared for the terminal and marine traffic route. In addition to the risk analyses, background data included the project EIA and related surveys. Shoreline types and important human use areas were mapped using video overflight data (with internal latitude / longitude overlay) verified by ground truthing.
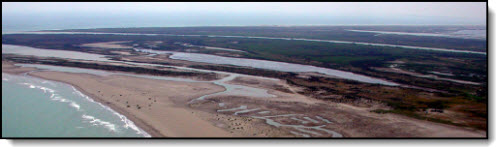
 areas of the world. During the warmer months, they are home to approximately 1 million fur seals and over 3 million seabirds. Greatest populations occur from mid-May to September, but some fur seals remain into December. An oil spill during this time would be devastating. At other times of the year, it has the potential to affect over-wintering species and may interfere with fur seals returning the next season. Several ship wrecks and oil spills have already occurred, the most recent being a spill of unknown origin during the winter of 1996, when hundreds of birds were affected. Working together, state and federal agencies have undertaken specific measures to reduce the risk of spills in this area, and to better plan if one should occur. The poster-sized map was prepared in English, Russian and Japanese, with the intent to be given to fishing vessels working in the area.
 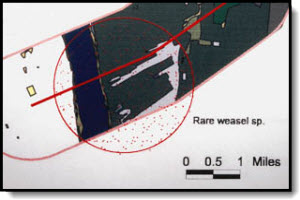 in the northeast, north-central, south, southeast, and western parts of the U.S. Pipeline diameters varied from 8" to 40". The analysis of sensitive resources included information on threatened, endangered, and protected species, sole source aquifers, community drinking water supplies, wetlands, protected state and federal lands. Cost estimates were made for each segment for positioning remotely controlled block valves, hydrostatic testing, and smart pigging, in response to the collected environmental data. Costs were then extrapolated to the pipeline industry as a whole to provide estimates of total industry costs of each method.
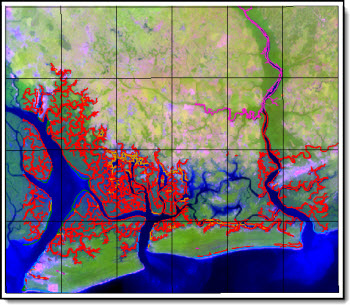 recognize ESI maps as useful tools for improved oil spill response. Their regulatory requirements stipulate a need for improved oil spill contingency planning. Towards this end, ESI mapping was carried out for both coastal and land-based environments in Oil Mining Lease area 11 in the Niger River delta. This project was the first application of the ESI protocols developed under sponsorship of the oil industry in Nigeria.
 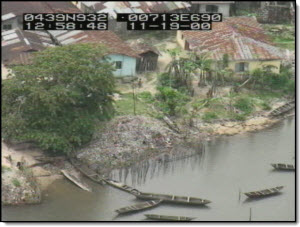 Some of the most diverse communities (exposed rocky shores) may be ranked low because wave action negates many affects of the oil. Land-based habitats do not have this capability and therefore needs another mechanism to determine “sensitivity” to oil.
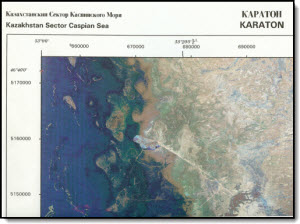 future seismic operations, a broad range of environmental and technical data from the region was collected and evaluated. Information was then used to develop a series of sensitivity maps indicating (1) biologically important areas, (2) biotopes (both terrestrial and aquatic habitats), (3) major infrastructure and existing sources of pollution and environmental impact, and (4) geologic and geomorphic subdivisions. Both fieldwork and LANDSAT image analysis (1:200,000 scale) were used to delineate land and coastal habitats. Map text was provided in both English and Russian. The sensitivity of habitats and species was categorized in terms of location and life stage.
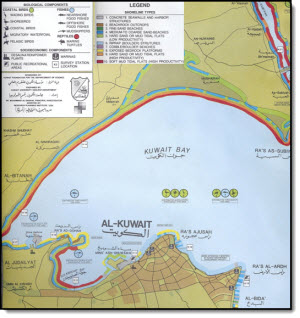 characterization study was carried out by a joint Kuwaiti-U.S. study team including Dr. Mohammed Al Sarawi of Kuwait University. The study characterized the shoreline and its habitats in terms of shoreline type, ecological components, sediment type, beach slope, and grain size. The shoreline types of Kuwait were ranked as follows in terms of increasing sensitivity to oil spills:
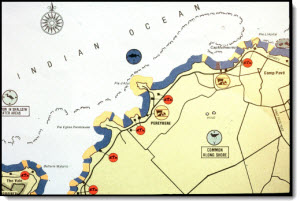 Environment Program sponsored this project to develop a Coastal Sensitivity Atlas detailing the sensitive resources of Mauritius and the methods for their protection. The project was developed in support of the Convention for the Protection, Management and Development of the Marine and Coastal Environment of the Eastern African Region and its protocol on emergency cooperation. The project included extensive participation of Mauritian scientists and resource managers and close ties with the Ministry of Housing, Lands and the Environment to ensure the incorporation of all relevant environmental and socio-economic resource data. Detailed response procedures were worked out between agencies by our personnel serving as a catalyst. All documents were produced in French and English.
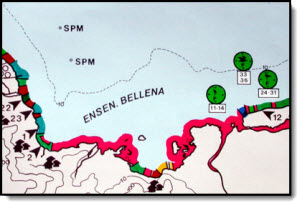 Panama (Atlantic and Pacific Coasts) and for the Panama Canal. In both cases, sensitivity maps included shoreline and wildlife information to enable spill response planning